Coronavirus crisis: Rutland tops for weekly cases after numbers almost treble
By The Editor 8th Feb 2021


Rutland has topped a table for Covid-19 infections.
The move contrasts the county's earlier record, which had previously shown Rutland among one of England's better performers.
The figure comes from the NHS Progression Dashboard, which shows both the rate of triage for coronavirus (COVID-19) using NHS Pathways, and the number of people confirmed by a lab to have coronavirus (a positive test).
Using this methodology, Rutland has seen a 185 per cent increase on last week - pushing its rate up to 463.3 cases per 100,000 people, the highest in the country.
It equates to 185 new cases between January 29 and February 4.
Last week, the same dataset showed that Rutland had recorded a rate of 200.4 cases per 100,00 people putting it in 120th place.
The area did see a ten per cent rise with 80 cases confirmed between January 24 and 30.
This dashboard also shows coronavirus infection rates in Leicester are nearing 300 cases per 100,000 and 200 in Leicestershire.
The seven-day rates in both the city and county are slowly dropping to their lowest level, since well before Christmas and the second November lockdown.
NHS Progression dashboard data puts the city's rate for the seven days before February 4, at 313.6 cases per 100,000, down 18 per cent on the week before.
Leicestershire's rate, for the same time period, is recorded at 203.6 cases per 100,000, a drop off of 15 per cent.
Topping the overall infection rate table, is Rutland, which NHS data says has seen a 185 per cent increase on last week – pushing the rate up to 463.3 cases per 100,000 people, the highest in the country.
It equates to 185 new cases between January 29 and February 4.
Last week, the same dataset showed that Rutland had recorded a rate of 200.4 cases per 100,00 people putting it in 120th place after a ten per cent rise with 80 cases confirmed.
The national rate, according to the same data is 203 cases per 100,000 people.
The dashboard shows that 1,111 cases were recorded in Leicester, which sits in 13th place overall.
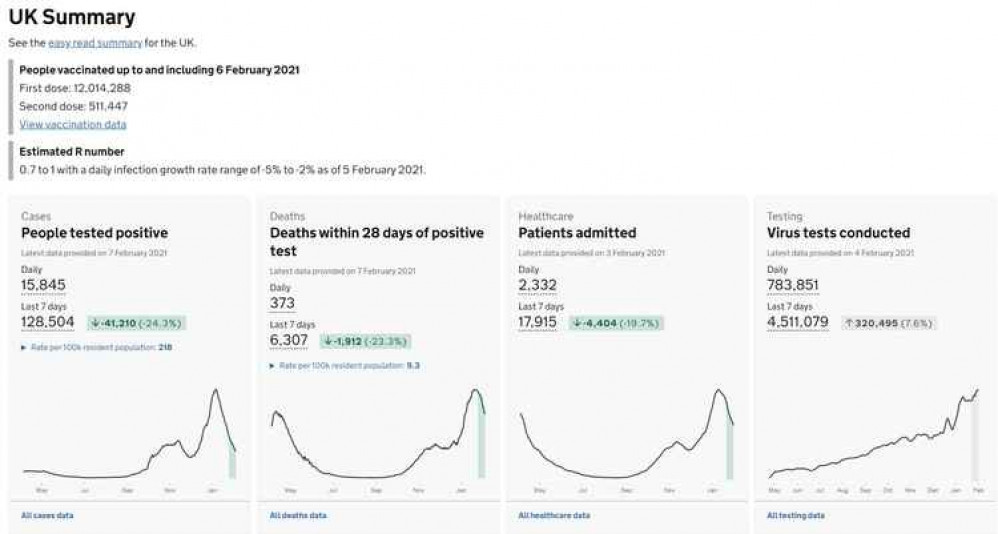
Leicestershire, in 71st place, added 1,438. Both the city and county have moved up the table since the last update but infection rates are still dropping, just slower than other areas near to them in the rankings. The daily number of cases recorded in the UK continues to fall, but remains high, with another 15,845 new cases reported on Sunday. The government is on course to meet its target of giving 15 million people, in the top four priority groups, their first vaccine dose by February 15. More than 150,000 people in Leicester, Leicestershire and Rutland have had their injection.- In the UK Government's Covid-19 tracker, Rutland also showed an increase in cases, reporting 77 over the weekend, which until a few days ago was what it was recording in a week.
CHECK OUT OUR Jobs Section HERE!
oakham vacancies updated hourly!
Click here to see more: oakham jobs
Share:


