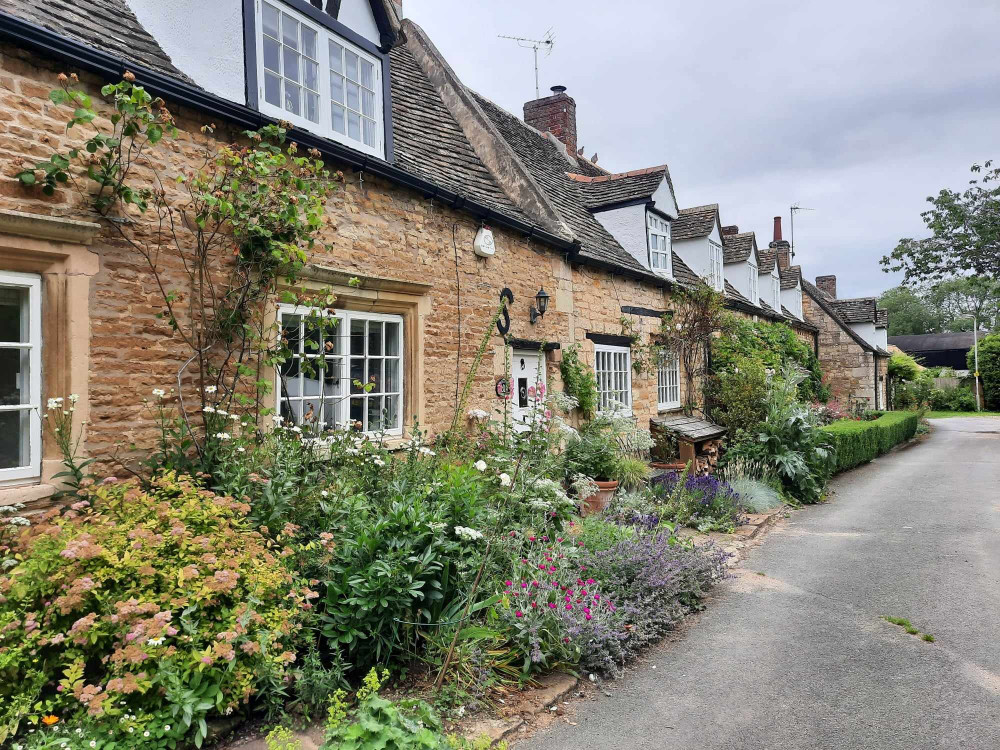
Rutland is England’s top house price hot spot
By Evie Payne 9th Nov 2023


Rutland in the East Midlands is England's house price hot spot, new research has revealed.
The study, by British Gaming site Amazon Slots, analysed the latest Land Registry data on average house prices in more than 400 areas across the UK, to discover where has seen the biggest increase in price over the past 12 months.
The data revealed that houses in Rutland in the East Midlands have seen England's biggest increase in cash value over the past year, going from £379,817 to £430,288 over 12 months. The rise of £50,471 represents a 13.3% increase on the average value in August 2022, which is the second biggest percentage increase in the UK, behind only East Lothian in Scotland.
East Lothian is where the biggest percentage increase in average house price occurred. There was a jump of 15.4% from August 2022 to August 2023, after the average home's sale price in the area went up by £45,050 – from £291,835 to £336,885.
Harborough in Leicestershire is third overall and the second English area to appear in the top five, with average house prices measured at £390,734 in August this year, compared to £348,355 in 2022. That is a 12.2% difference of £42,379.
Another Scottish area takes fourth place in the UK ranking, with Na h-Eileanan Siar, also known as the Outer Hebrides, seeing its average house price go up by 11.8% between August 2022 and 2023. The average now stands at £173,552, up £18,266 from £155,286 12 months previously.

North Warwickshire places fifth in the UK, behind Na h-Eileanan Siar thanks to a £20,540 jump in average house price. It has gone from £250,442 to £270,982, which is an 8.2% increase.
The UK top seven is completed by Newcastle upon Tyne in sixth place going from £188,878 to £204,356, an increase of 8.2%, and Vale of Glamorgan in seventh, with an 8% rise from £305,884 to £330,392. North Tyneside and South Tyneside both saw 7% rises, putting them in eighth and ninth place, while Oxford is in tenth with a 6.8% rise.
At the other end of the scale, the biggest drop in average house price between August 2022 and 2023 occurred in Hastings, where it fell by 10.4% from £291,374 to £261,075 - a decrease of £30,299.
The average house price in London borough of Kensington and Chelsea saw the second biggest year-on-year percentage drop, falling from £1,516,656 to £1,358,879. The decrease of £157,777 represents a -10.4% difference.
Meanwhile, in contrast to Na h-Eileanan Siar, the Shetland Islands have seen the third biggest fall in average house prices in the past year – a 7.6% decrease of £14,988 , from £196,809 to £181,821.
Commenting on the study, a spokesperson for Amazon Slots said: "There has been a lot of turmoil in the housing market over the past year, so it's fascinating to see the data on which places have been most and least impacted. On a national level, the UK's average house price in August 2022 was £290,541, and had gone up by £503 to £291,044 in August 2023, which is a 0.2% increase. In contrast, the increase in the previous year, from August 2021 to 2022, was 11.5%, which highlights just how much growth has slowed."
CHECK OUT OUR Jobs Section HERE!
oakham vacancies updated hourly!
Click here to see more: oakham jobs
Share:


